 VALO
VALO How to Use Comparable Sales Data to Win a Listing Presentation
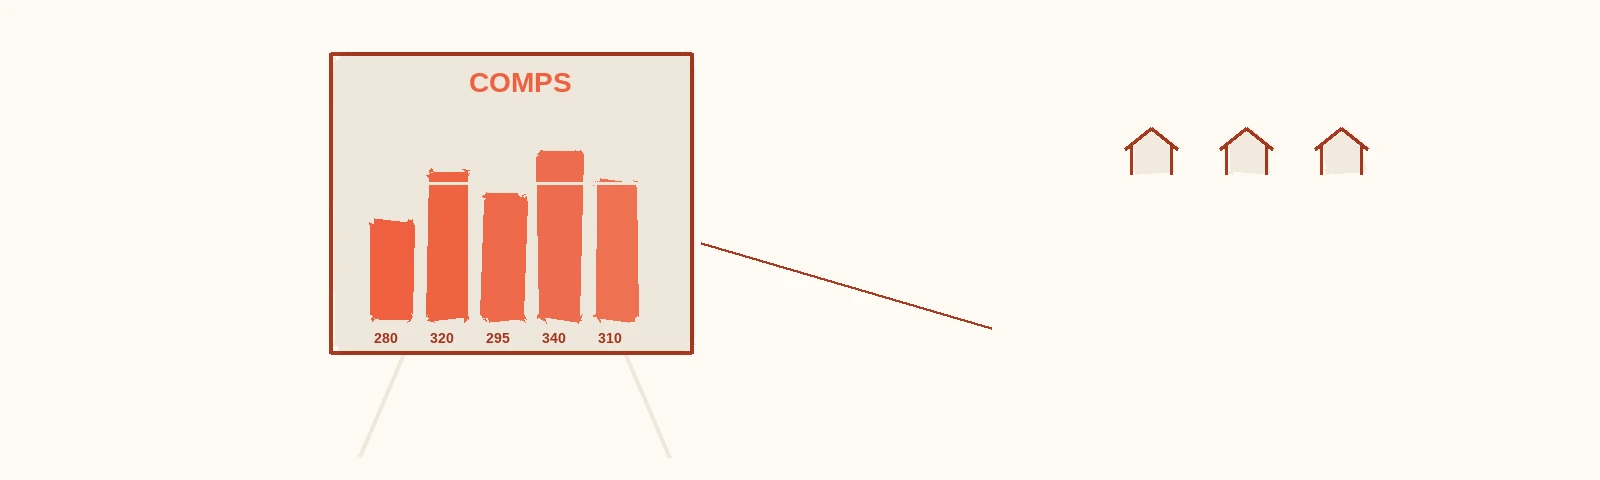
The broker who walks into a listing presentation with a single number loses to the broker who walks in with a story told through data. Comparable sales are not just reference points - they are your primary persuasion tool. The way you select, adjust, and present them determines whether the homeowner sees you as a credible professional or another agent guessing at a price.
Most brokers underuse their comparable sales data. They pull 3-5 sales, calculate an average, and present a range. That approach leaves money and trust on the table. The brokers who convert at the highest rates treat their CMA as a narrative instrument - each comparable chosen to make a specific point, each adjustment explained to build credibility.
What makes a comparative market analysis persuasive?
A persuasive CMA does three things: it demonstrates thorough market knowledge, it explains why the recommended price is what it is (not just what it is), and it preemptively addresses the homeowner’s likely objections. According to a survey by the National Association of Realtors, 82% of sellers choose their agent based on the agent’s pricing strategy and market knowledge - ahead of commission rate (67%) and marketing plan (54%). Your CMA is not a supporting document. It is the presentation.
The common mistake is treating comparable sales as evidence for a predetermined conclusion. Homeowners detect this instantly. A study published in the Journal of Real Estate Research found that sellers rated agents 40% higher on trustworthiness when the agent presented data that included unfavourable comparables alongside favourable ones, compared to agents who only showed data supporting their recommended price.
Transparency builds trust. Cherry-picking destroys it.
How do you select the right comparables?
Selection is where most CMAs fail. Brokers default to the 5 most recent sales in the neighbourhood, regardless of relevance. A disciplined selection process uses three filters in order: proximity, similarity, and recency.
The selection framework
Filter 1: Proximity (500m radius). Start with sales closest to the subject property. Properties on the same street or in the same building carry the most weight with homeowners because they cannot argue with geography. Expand to 500 metres, then 1 kilometre if needed.
Filter 2: Similarity (size, type, condition). From your proximity pool, select properties that match the subject in size (within 15%), type (apartment to apartment, house to house), and approximate condition. A renovated penthouse is not comparable to an unrenovated ground-floor unit, even if they are next door.
Filter 3: Recency (90 days preferred, 180 max). Market conditions shift. In active markets, a sale from 9 months ago may reflect a different pricing environment. Prioritize the last 90 days. Include 6-month sales only if you need to fill gaps.
How many comparables should you present?
Five to seven is the ideal range. Fewer than five looks thin and invites the question “is that all?” More than seven overwhelms the homeowner and dilutes your narrative. According to research on cognitive load published in the Journal of Consumer Research, decision-makers process information most effectively when presented with 5-7 options - fewer feels incomplete, more causes analysis paralysis.
Of your 5-7 comparables, identify 2-3 as your “anchor comps” - the sales most similar to the subject property that form the core of your pricing argument. The remaining comparables provide context: the upper boundary, the lower boundary, and the outliers that need explanation.
How do you adjust comparables for a fair comparison?
Raw comparable data is misleading without adjustments. A sale at 3,400 per square metre for a renovated property and 2,800 for an unrenovated one are not contradictory data points - they are consistent once you account for condition. Your job is to normalize the data so the homeowner sees an apples-to-apples comparison.
The four standard adjustments
| Adjustment | Typical Impact | How to Calculate |
|---|---|---|
| Condition | 10-25% variance | Compare renovation level of comp to subject (see condition framework below) |
| Size | 3-8% per 10m² difference | Larger properties typically have lower price-per-m²; adjust proportionally |
| Floor/orientation | 2-8% per floor level, 3-5% for orientation | Higher floors and south-facing units command premiums in most markets |
| Parking/storage | Fixed value (5,000-25,000 depending on market) | Add or subtract the market value of included parking/storage |
The Appraisal Institute recommends presenting adjustments in a grid format - one row per comparable, one column per adjustment factor, with a final column showing the adjusted price. This format lets the homeowner follow your logic step by step.
Condition adjustment detail
| Level | Description | Adjustment vs. Fully Renovated |
|---|---|---|
| Original | Dated kitchen, original bathrooms, functional but old | -15% to -25% |
| Cosmetic update | Painted, minor fixes, functional updates | -5% to -15% |
| Fully renovated | Modern kitchen and bathrooms, quality materials | Baseline (0%) |
| Premium renovation | Designer finishes, high-end everything | +5% to +10% |
Present the adjustment logic before showing the adjusted numbers. Say: “I am going to adjust each comparable for condition, size, and floor level so we are comparing like with like.” This frames the adjustments as objective methodology, not subjective manipulation.
For more on handling conflicting comparable data, see How to Price a Property When the Market Data Contradicts Itself.
How should you present the CMA during the listing appointment?
Presentation format matters as much as content. A printed, bound document communicates professionalism. A hastily opened laptop screen says you pulled this together on the drive over.
The presentation sequence
Step 1: Context before data (2 minutes). Before showing any numbers, frame the market: “The market in your neighbourhood has been active over the past 6 months. We have seen 14 transactions within 1 kilometre, with an average time on market of 47 days. Here is what that means for your property.”
Step 2: The comparable overview (5 minutes). Present all 5-7 comparables in a table format. Walk through each one briefly: address, sale date, size, condition, sale price. Do not adjust yet - let the homeowner absorb the raw data first.
Step 3: Adjustments and analysis (10 minutes). Now introduce your adjustments. Explain each factor, show the math, and arrive at the adjusted price for each comparable. This is where you demonstrate expertise.
Step 4: Your recommendation (3 minutes). Based on the adjusted data, present your pricing recommendation using the three-number framework: competitive price, market price, and aspirational price. A study by Redfin found that homes priced at market value received an average of 2.3 offers within the first two weeks, while those priced 5-10% above received an average of 0.7 offers in the same period.
Step 5: Strategy discussion (10 minutes). Discuss which pricing approach aligns with the homeowner’s goals. Some want speed, some want maximum price, some want both (and need to understand they may have to choose).
For understanding what truly drives homeowner decision-making during these conversations, see What Homeowners Actually Want When They Request a Valuation.
How do you use comparables to handle objections?
Every homeowner objection has a comparable that answers it. The key is anticipating objections and having the right comparable ready.
“My property is better than those.” Response: Point to the premium comparable in your set. “This one at 3,400 per square metre was also fully renovated with similar finishes. It sold for X, which aligns with my recommendation for yours.”
“Prices are going up - those sales are old.” Response: Show the time adjustment. “You are right that the market has moved. I have applied a 3% upward adjustment to sales from more than 3 months ago. That adjustment is already reflected in my recommendation.”
“The online estimate says more.” Response: “Online estimates use automated models that cannot see inside a property. They typically have a 5-15% margin of error. My analysis uses actual transaction prices - what buyers actually paid - with adjustments for condition and features. That is a more reliable picture.”
“I need to get at least X because of my mortgage.” Response: This is a financial need, not a market reality. Acknowledge it with empathy: “I understand there is a number that matters to you financially. My job is to show you what the market data supports, so you can make the most informed decision.” Never promise a price based on the seller’s financial needs - it is a path to failed listings and damaged relationships.
For a deeper look at how valuation conversations build the trust needed to navigate these objections, see Why a Valuation Conversation Beats an Online Form Every Time.
Frequently asked questions
Should you include current listings as comparables?
Include current listings as supplementary context, not as primary comparables. Current listings show what competing properties are asking, which helps the homeowner understand market positioning. But asking prices are not transaction prices - they represent hope, not evidence. Present them in a separate section labelled “Currently on the market” and note that final sale prices typically come in 5-12% below asking price depending on the market.
How often should you update your CMA if the listing does not sell?
Update your comparable sales data every 30 days while a listing is active. New transactions, expired listings, and price changes in competing properties all affect your positioning. Present the updated data to the homeowner during your regular check-in as evidence for any recommended price adjustment. Fresh data makes price reduction conversations factual rather than emotional.
What is the biggest mistake brokers make with comparable sales data?
Presenting raw averages without adjustments. An average of 5 sales that includes a distress sale, a premium renovation, and three standard transactions produces a meaningless number. The homeowner who does their own research will find the highest comparable and anchor to it. Your job is to show them the adjusted reality - which requires doing the analytical work that most brokers skip.